If your executive board, plant management cells, and automation engineers still view instrument calibration as a superficial, scheduled sticker-pasting ritual to satisfy compliance audits, your enterprise is operating an automated production pipeline over an extreme-risk asset abyss. In the digital industrial era, international audit bodies and upper-tier quality control frameworks reject data models based on subjective stability assumptions; they deploy rigorous probabilistic mathematical models and metrological systems with absolute traceability chains to expose every molecular deviation and systemic error hidden inside your process control loops.
Measurement data accuracy tolerates zero behavioral margins. A single flow sensor suffering an uncorrected zero-point drift at the third decimal place, or an improperly evaluated expanded measurement uncertainty ($Uncertainty$), is enough to cause an immediate collapse of your plant’s entire material balance and mixing architecture, transforming multi-million dollar process batches into scrap waste.
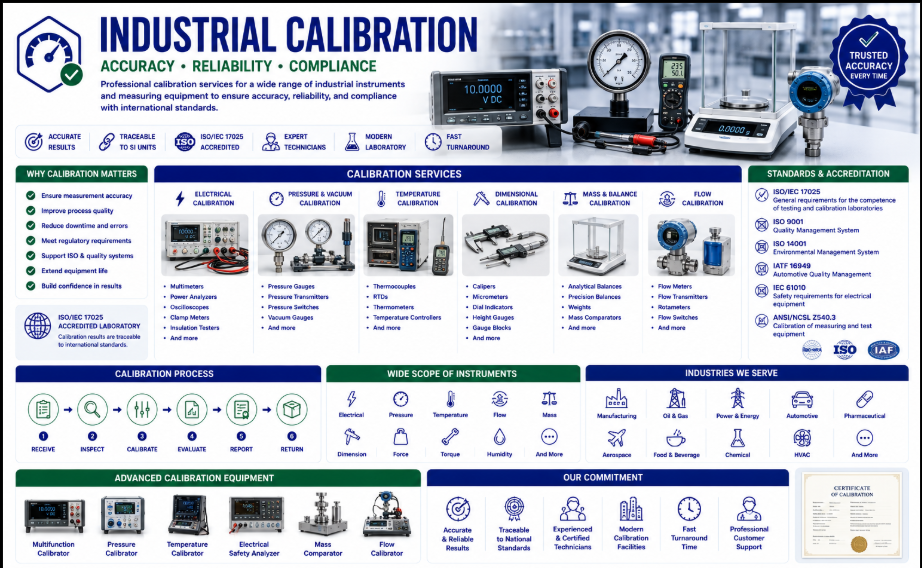
The Clinical Instrument Error Evaluation Reference Frame: Our laboratory methodology bypasses superficial qualitative readings. The core of modern industrial calibration rests on the capability to isolate measurement drift kinetics ($Sensor\ Drift$) and determine the absolute error structure of devices under continuous operational stress. This architecture dictates full operational mastery over un-broken metrological traceability chains back to national and international primary standards (NIST, PTB). From deploying high-stability thermal baths to isolate temperature sensor non-linearities, utilizing hydrostatic primary pressure balances, down to calculating expanded uncertainty matrices ($U$) in accordance with the Guide to the Expression of Uncertainty in Measurement (GUM). A single trace error in the analog feedback signal ($4\text{-}20\text{ mA}$) of a control valve is enough to deactivate the optimization algorithms of the entire distributed control system (DCS).
For Plant Managers and Lead Automation Engineers, commanding this analytical metrological testing footprint represents the only technocratic mechanism to strip hardware of error-reporting capabilities, safeguard manufacturing operating capital (OPEX), and lock down the legal validity of factory data.
1. Systemic Bottlenecks: Measurement Drift and Micro-Mechanical Wear Kinetics Silently Deactivating Process Pipelines
Through empirical metrological failure forensics (Metrological Failure Analysis) and raw material yield discrepancy interventions across heavy processing plants, we have isolated 3 structural blind spots that routinely deplete factory operating margins:
- Drift Kinetics Driven by Material Aging and Environmental Stress: Under the stress of thermal cycling, pressure oscillations, and low-frequency mechanical vibrations, the physical structures of sensor elements undergo micro-electro-mechanical deformation. This degradation induces systematic zero drift ($Zero\ Drift$) and linear span distortion ($Span\ Error$), driving instruments to continuously transmit corrupted process variables to the control center while SCADA monitors display simulated safe-state baselines.
- Hysteresis Accumulation and Spontaneous Material Corrosion Barriers: The appearance of mechanical hysteresis ($Hysteresis$) in pressure diaphragms or the build-up of chemical corrosion film from process fluids on active sensor electrodes creates an energy barrier. This constraint dampens instrument response time ($Response\ Time$) and warps signal linearization scales, directly destabilizing the fine-tuning of Proportional-Integral-Derivative (PID) control loops.
- Test Uncertainty Ratio Collapse and Operational Control Blind Spots: When primary reference standards degrade or when the Test Uncertainty Ratio ($TUR$) between the reference standard and the Unit Under Test (UUT) drops below the critical threshold ($< 4:1$), the calibration model suffers a catastrophic loss of resolution. This creates a metrological blind spot that invalidates product acceptance boundaries, accepting defective batches on paper while rejecting conforming ones.
The consequence of loose metrological asset governance is the immediate trigger of unplanned plant shutdowns ($Unplanned\ Downtime$), raw material and utility consumption overruns of $3\% \text{ to } 5\%$, and the permanent loss of technical competitiveness during international contract bidding.
2. Solution Matrix: Locking Tolerances via 4-Tier International Standard Calibration Tollgates
To completely neutralize systemic errors and instrument drift variables, our quality framework enforces systematic multi-tier pre-calibration checks across the entire asset lifecycle:
- Multi-Point Dynamic Scans and Wide-Range Calibration Validation: Bypassing single-point check approximations, we execute dynamic instrument error logging across the entire actual process range utilizing 5 to 11 calibrated points to precisely track non-linear characteristics, instrument repeatability ($Repeatability$), and error profiles under fluctuating process dynamics.
- Mathematical Error Isolation in Accordance with GUM Guidelines: Developing rigorous mathematical measurement models for each procedure to isolate and quantify all component error budgets: including reference standard uncertainty, environmental conditions (laboratory temperature and relative humidity shifts), and UUT resolution limits, outputting certificates with expanded measurement uncertainty ($U$) at a $95\%$ confidence interval.
- Un-Broken Metrological Traceability Chain Verification: Guaranteeing that every single calibration execution demonstrates an ironclad, documented path back to national metrology institutes (VMI) or international bodies (NIST, PTB), locking down the legal validity of measurement data against global trade audit challenges.
- Automated Drift Trend Analysis and Predictive LIMS Management: Integrating historical calibration records into an automated Laboratory Information Management System (LIMS), leveraging trend-line algorithms to calculate the exact timeline before an instrument crosses its Out-of-Tolerance ($OOT$) boundary, optimizing recall intervals based on mathematical evidence rather than arbitrary schedules.
3. Metrological Performance Metrics: Converting Compliance Boundaries into Operating Capital Surplus (OPEX Optimization)
Commanding a factory-wide metrological verification infrastructure backed by precision data and statistical mathematics is the ultimate financial mechanism to safeguard corporate cash flow and eliminate manufacturing asset leakage:
| Process Operational Risk Indicators | Saturated Metrological Forensic Governance | Passive Plant Operations Reliant on Nominal Instrument Ratings |
| Material Sourcing & Utility Feed Efficiency | Tightens process flow and mass-balance loops, eradicating invisible mass losses and cutting raw material and energy consumption by $1\% \text{ to } 3\%$. | Drifting instruments skew blending ratios and catalyst delivery, introducing undetected energy waste and chemical additive overruns into the reactor core. |
| Batch Defect Rates and Consistency Profiles | Holds critical process parameters (Temperature, Pressure, pH) within optimum control envelopes ($CPK > 1.33$), eliminating thermal-induced quality variances. | Yield outputs exhibit cyclical quality spikes, exposing the plant to severe customer rejection penalties due to off-specification material metrics. |
| International Regulatory Audit Integrity | Effortlessly clears aggressive technical inspections by the US FDA, WHO, or demanding downstream buyers due to transparent, trace-validated data. | Management systems face operational suspension due to calibration records that fail to prove unbroken traceability or lack uncertainty calculations. |
4. Technical Action Roadmap: Interlocking Metrological Governance Barriers from Lab Cells to DCS Nodes
Our industrial drift mitigation protocol is deployed sequentially, embedding directly into active maintenance schedules and DCS automation layers:
- Step 1 – Criticality Mapping and Instrument Stratification: Auditing the full plant P&ID schematics to stratify instrument assets into targeted groups: Quality Critical (QA), Safety Critical (HSE), and Process Monitoring, ensuring maximum resource allocation efficiency.
- Step 2 – SOP Standardization and Experimental Method Validation: Authoring rigid Standard Operating Procedures (SOPs) for specialized instrument profiles, ensuring reference environmental parameters (thermal, moisture, and ambient vibration baselines) settle into a static state before comparative measurements begin.
- Step 3 – High-Fidelity On-Site and Lab Calibration Execution: Utilizing mobile calibration arrays or dedicated ISO/IEC 17025 accredited laboratory facilities to execute real-time error isolation, enforcing an internal process safety margin at least $30\%$ below maximum allowable limits.
- Step 4 – Hardware Calibration Matrix Flashing and Offset Corrections: Uploading calculated correction values ($Correction$) directly into PLC/DCS registries or updating smart field instrument fieldbus configurations (HART/Profibus), overriding hardware inaccuracies through digital algorithms before asset re-commissioning.
5. Driving Verifiable ESG Milestones via High-Fidelity Clean Processing Parameters
Controlling measurement instrument integrity through unalterable data models represents definitive proof of an enterprise’s execution of its ESG (Environmental, Social, Governance) mandates with scientific honesty:
- The Environmental Pillar (Environment): High-precision auditing of exhaust stack analytics, wastewater discharge flowmeters, and energy consumption inputs allows engineers to optimize boiler efficiency, reducing carbon footprint ($CO_2$) emissions and blocking chemical runoff spikes into local ecosystems.
- The Social Pillar (Social): Establishes absolute occupational safety barriers for plant personnel by ensuring pressure transmitters, thermal trip relays, and toxic gas leak sensors operate with $100\%$ accuracy, preventing catastrophic industrial pipeline explosions.
- The Governance Pillar (Governance): Swaps manual logging with tamper-proof, trace-validated digital calibration data architectures, satisfying global energy audits and green manufacturing corporate disclosure statutes.
Conclusion
Industrial Calibration is no longer a superficial maintenance checkmark tucked away on a routine calendar. It is the core technocratic competency that dictates the scientific validity of your data, the financial safety of your operating margins, and your legitimate right to operate within the global digital industrial ecosystem.
Commanding an instrument network that controls measurement error through an ironclad mathematical testing matrix provides your business with a definitive passport across international auditing barriers. It insulates your manufacturing yield from systemic losses and establishes your plant as an elite facility operating at peak economic and physical optimization.
Contact us today to receive dedicated advice and the most suitable solution for your business!
Hotline: +84 933096426 – +84 868 591 260
Email:
Website:
Partners in Vietnam:
Contact Vietnam representative: Duc Luong Services
Hotline: +84 933096426 – +84 868 591 260
Email: ducluongservices@gmail.com
Website:
STC VN Co., Ltd.
Hotline: +84 933096426 – +84 868 591 260
Email: info@staunchlyservices.com.vn
Website: https://stauchlyservices.com.vn


No responses yet